
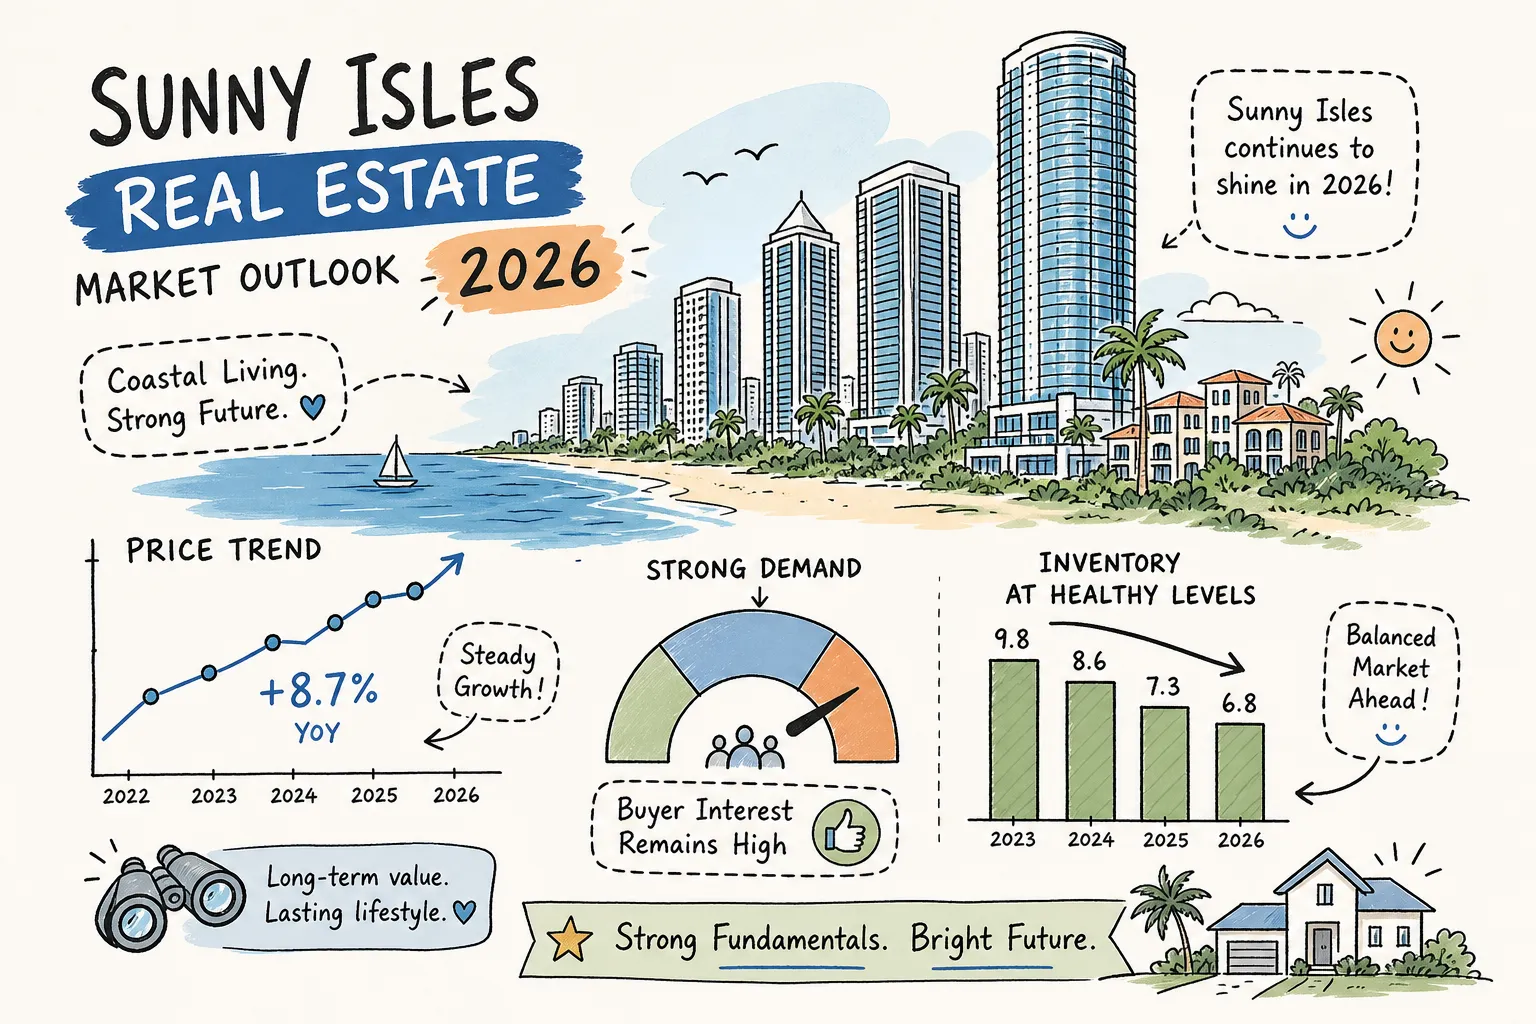
The sunny isles real estate market in 2026 is telling a nuanced story, and the data backs it up at every turn. Median sale prices have softened from their 2024, 2025 peaks, condo inventory has climbed to its highest levels in several years based on MLS tracking, and yet transaction counts are ticking upward. That combination creates real opportunity, but only for buyers and sellers who know which numbers actually matter at the building level.
This report breaks down current conditions in the sunny isles real estate market using verified 2026 figures: median prices, price per square foot trends, days on market, absorption rates, closed sales volume, and rental yields. The analysis reflects the kind of daily market tracking that drives the work at Andres Jara | South Florida Luxury Real Estate, where building-specific closed-sale data drawn from live MLS feeds shapes every pricing and offer strategy.
Sunny Isles real estate market: Condo and single-family prices in 2026
Over the trailing twelve months, the Sunny Isles Beach median sale price is around $594,500 across roughly 700 closed transactions. Asking prices sit well above that, reflecting a wide gap between what sellers are listing for and what buyers are actually paying. This spread is not noise. It reflects a market where overpriced listings are sitting and correctly priced units are clearing, a pattern visible in the share of listings that have undergone at least one price reduction and in the distribution of closing prices relative to final list prices. Buyers with building-level comparables can immediately identify which asking prices are grounded in reality and which are not.
The single-family segment operates on entirely different dynamics. Sunny Isles has only a handful of detached homes, and with so few transactions, one outlier sale shifts the median significantly. Buyers and sellers in this segment need closed-sale history at the property level, not broad neighborhood averages, to price or negotiate with any confidence.
In both segments, the gap between list and sale price is a direct negotiation signal. In the condo market, buyers have leverage on listings priced above recent comparables. In the single-family market, sellers retain more negotiating position, though the wide list-to-sale spread confirms that even motivated buyers are not paying full ask. The real edge lives in knowing which specific units closed at or above list and which sat and discounted.
Price per square foot after the peak: reading the correction correctly
Sunny Isles Beach condo prices peaked around 2024 to 2025 before softening in 2026. The median price per square foot now sits around $660, down roughly 10% year over year on our data. Over a longer horizon, however, values remain well above pre-surge levels. The correction is real, but it is correcting off a peak, not collapsing back to earlier pricing.
A roughly 10% year-over-year price-per-square-foot decline in a market with well over a year of condo supply creates a specific window. Sellers who listed in 2024 at peak metrics are now competing with more inventory at lower effective prices. For buyers, this is the first meaningful period in several years where the market structure favors patient negotiation over competitive bidding. For sellers, pricing at 2024 comparables in a 2026 market directly causes extended days on market.
One more nuance worth understanding: different platforms report Sunny Isles price-per-square-foot figures that vary by as much as 25%, depending on whether they include all residential sales, condos only, or distressed transactions. A broader-market median reflects a different property mix than a condo-specific figure, so the dataset your pricing decision rests on matters. The dataset your pricing decision rests on matters more than most buyers realize.
Inventory and absorption: what nearly 28 months of supply means for you
Months of supply
As of late 2026, Sunny Isles Beach has approximately 1,070 active condo listings. At the current pace of absorption, that represents close to 28 months of supply. A balanced market typically sits between 4 and 6 months, a benchmark widely used by MLS associations and real estate economists alike. At 18-plus months, this is unambiguously a buyer’s market for condos. Buyers have options, time to compare, and room to negotiate. Sellers face real competition from a large pool of comparable listings and need a pricing strategy built on current, building-specific closed sales, not last year’s peak comparables.
For context, Sunny Isles Beach carries more condo inventory than either Miami Beach or Aventura as of October 2026. Miami-Dade’s broader market sits closer to 14 months of supply, and Aventura runs around 24 months. Sunny Isles Beach’s figure puts it at the high end of buyer-favorable conditions across the region, particularly for older or overpriced units. Newer branded oceanfront projects within specific buildings may be considerably tighter than the citywide average.
Days on market
The single-family side is very thin, and the scarcity of product means sellers retain more negotiating power than in the condo segment. Condo listings are taking a median of roughly 104 days to go under contract, while the handful of single-family homes turn over far less predictably. These figures confirm what the absorption data suggests: condos are moving slowly, and sellers who need to close quickly must price aggressively from day one.
Transaction volume and closed sales: the paradox behind the numbers
Over the trailing twelve months, Sunny Isles Beach recorded roughly 700 closed sales totaling about $1.02 billion in closed dollar volume. With pricing off its peak, the pattern is clear: units are still selling, but at lower average prices than at the top of the market. Based on the $595,000 median and the volume decline, mid-range condos appear to be driving activity while larger, higher-priced units are taking longer to find buyers, a pattern consistent with the broader shift in where deals are clearing.
Closed condo sales have clustered around the area median near $595,000, with the mid-hundreds-of-thousands price band accounting for most closed deals given the median and the distribution of activity relative to asking prices. Units in this range represent entry-level luxury and value-oriented oceanfront access. They draw domestic buyers relocating from high-tax states, as well as international buyers using South Florida property as a portfolio anchor. Units in the millions are contributing proportionally less to transaction count despite holding the most dollar value per deal.
The investment case for Sunny Isles Beach luxury condos: what the math actually shows
Asking rents for Sunny Isles condos run well above the rents units actually achieve once signed, a substantial gap between marketing expectations and real income. Furnished units can ask more but tend to sit vacant longer between tenants on the rental market. Any investment underwriting that uses asking rent rather than achieved rent will significantly overstate projected income.
Gross rental yields for Sunny Isles Beach luxury condos are modest, and after HOA fees, property taxes, insurance, maintenance, and management, net yields compress considerably, especially for oceanfront units. HOA fees in luxury oceanfront buildings are among the highest in South Florida, often several thousand dollars a month. The margin for error is narrow. Seasonal furnished strategies can push gross yields higher, but come with meaningful vacancy and higher management costs.
The current yield environment makes Sunny Isles condos more compelling as wealth preservation vehicles and lifestyle assets than as pure income plays, particularly for Latin American and international buyers. For domestic investors seeking rental income, the numbers work best on lower-HOA, well-positioned units in the mid-hundreds-of-thousands range where the yield-to-cost ratio is most favorable. Trophy units in the millions tend to underperform on yield but hold value well across appreciation cycles. Conservative underwriting should use realistic achieved rents, a meaningful vacancy factor, and a modest gross yield as a baseline.
Why building-level data is the actual edge in Sunny Isles
A buyer comparing the area median near $595,000 across all of Sunny Isles Beach is working with data that mixes oceanfront penthouses, mid-floor resales, pre-construction assignments, and distressed units into a single number. Two buildings on the same block can have radically different absorption rates, HOA reserve health, and price-per-square-foot trajectories. A building where 40 units are listed simultaneously represents an entirely different investment calculus than one with three active listings and a strong closed-sale history at or above ask.
The top luxury buildings in Sunny Isles Beach each tell their own story. Buildings like The Reserve at Marina Palms, The Estates at Acqualina, Turnberry Ocean Club, the Ritz-Carlton Residences, and Parque Towers each post very different closed-sale volumes over a trailing year. Those differences represent fundamentally different supply and demand realities within buildings that are often just blocks apart. Averaging them into a single market figure obscures the decision-critical detail.
At Andres Jara | South Florida Luxury Real Estate, Sunny Isles Beach condo inventory, absorption rates, and closed-sale data are tracked at the building level using a building-level research. When a buyer is considering two oceanfront buildings, the analysis goes beyond neighborhood medians: it pulls closed-sale history within those specific buildings, compares floor lines and exposure impact on pricing, and identifies which units sat and repriced versus which cleared at full ask. That is the intelligence that converts market data into a confident offer strategy, whether you are buying, selling, or evaluating a building for long-term hold.
What the 2026 sunny isles real estate market means for your next move
The sunny isles real estate market in 2026 rewards preparation over speed. With well over a year of condo supply, a market median near 104 days to contract, and a double-digit year-over-year price-per-square-foot correction, buyers have genuine negotiating leverage for the first time in several years. That leverage is concentrated in listings priced at 2024 peak comparables that have been sitting. Units correctly priced against current building-specific closed sales are still moving with far less discount pressure.
For sellers, the message is equally clear. Broad neighborhood averages will produce a list price that either undersells a well-positioned unit or overprices one that will sit for months. The market has enough inventory that buyers are comparison shopping across buildings, floor lines, and exposures before making an offer. A pricing strategy built on internal building comparables, HOA cost transparency, and current absorption data is the difference between a timely close and an extended, discounted one.
For investors and buyers at any stage, the next step depends on where you are in the process. If you are in early research, building-level profiles and current MLS listings available through Andres Jara’s platform give you a real-time view of every active condo, its closed-sale comparables, and its price history across South Florida neighborhoods. If you are ready to narrow to specific buildings or structure an offer, contact Andres Jara directly for a conversation that translates this market data into a precise strategy for your target price point, preferred floor plan, and investment goals.